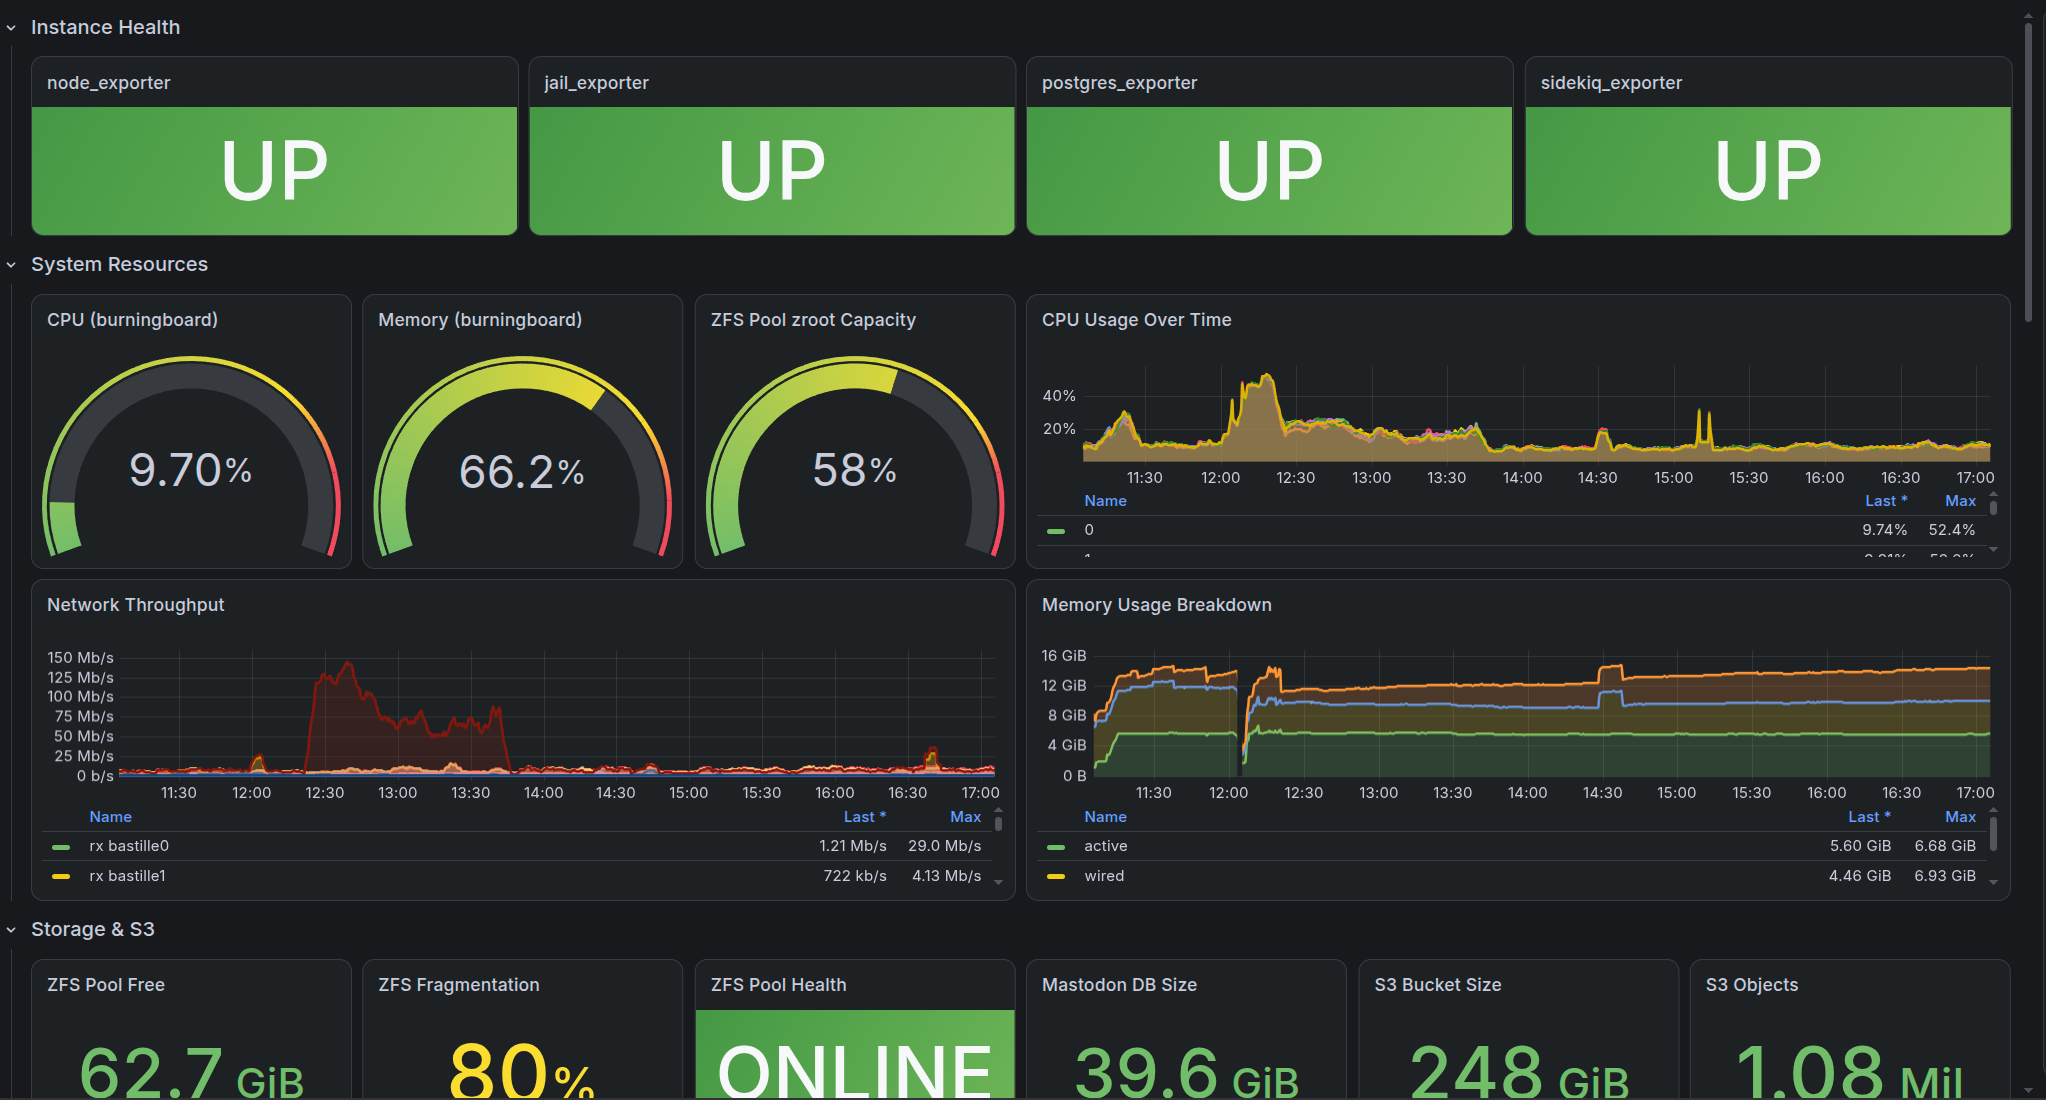
Our monitoring and search backends got some love too:
• Patched, and they now monitor themselves
• Dead man's switch: Prometheus -> Alertmanager -> Uptime Kuma, so we notice if monitoring itself dies
• Found an MTU black hole: our VXLAN allows 1332, FreeBSD guests sat at 1500. Small packets fine, big ones silently vanished 🙈
• Grafana cleaned up, broken analytics dashboard fixed
#FreeBSD #Grafana #Mastodon bbₜᵤₓᵢ (npub1zyt…u6da)