Event JSON
{
"id": "d89343b22498e929e585da41e63756abaaa6fffed715a09560300a7c8f0d0a50",
"pubkey": "2eb8978ec4577307b0b990ca5a8bd73d079451254ccdc7e79b5ede9e6548967b",
"created_at": 1762714983,
"kind": 1,
"tags": [
[
"imeta",
"url https://media.mathstodon.xyz/media_attachments/files/115/521/287/707/766/819/original/b7abbf7ccaba7996.png",
"m image/png"
],
[
"proxy",
"https://mathstodon.xyz/@johndcook/115521289138722014",
"web"
],
[
"proxy",
"https://mathstodon.xyz/users/johndcook/statuses/115521289138722014",
"activitypub"
],
[
"L",
"pink.momostr"
],
[
"l",
"pink.momostr.activitypub:https://mathstodon.xyz/users/johndcook/statuses/115521289138722014",
"pink.momostr"
],
[
"-"
]
],
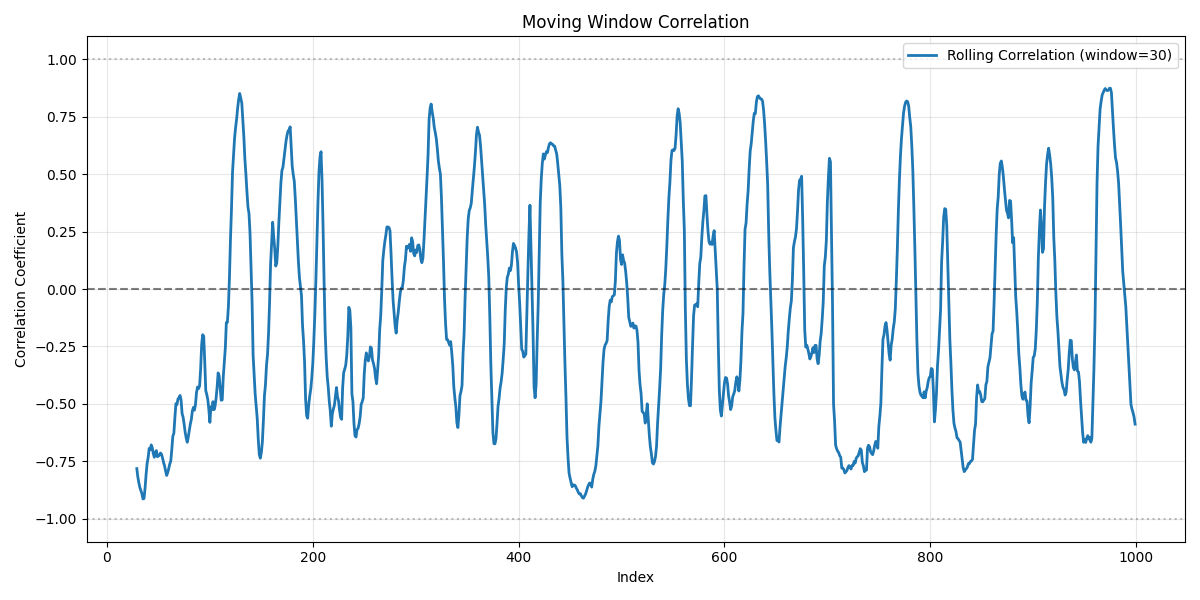
"content": "The graph below appears to show that the correlation between two stocks peaks about every 50 days. But this is purely an analysis artifact. The two series are in fact independent random walks. Shows how analysis can be misleading.\n\nhttps://www.johndcook.com/blog/2025/11/09/rolling-correlation/\nhttps://media.mathstodon.xyz/media_attachments/files/115/521/287/707/766/819/original/b7abbf7ccaba7996.png\n",
"sig": "a561dee35920d98636a4378889b7345a1f906fab0bfb443ff1072d96b2568135e09a9c4ad80a676bbc602160b688ea8012343def01985321e9d4cd87f2d5e095"
}