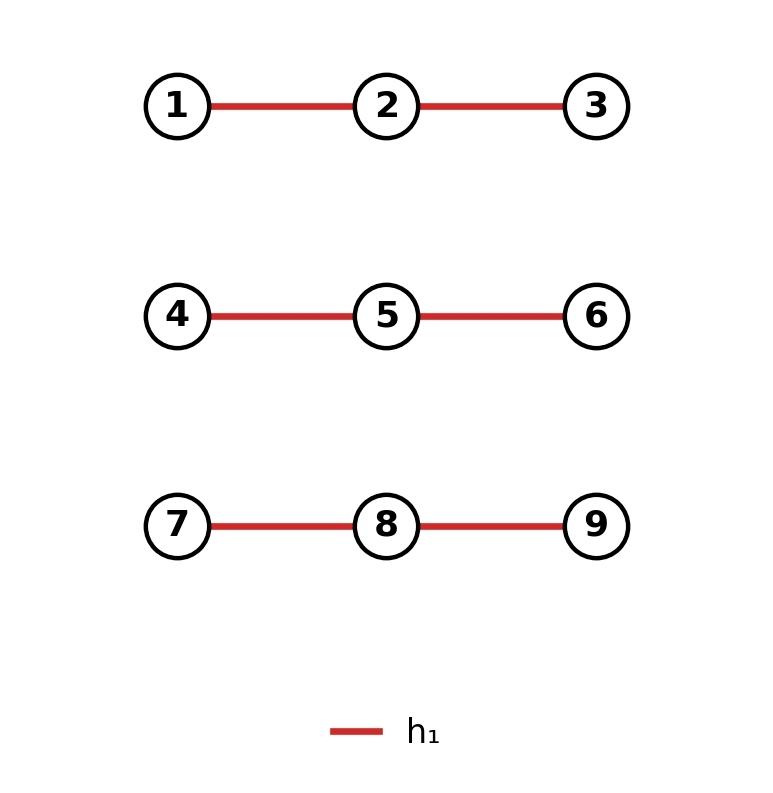
h₁ = x₁∧x₂∧x₃ + x₄∧x₅∧x₆ + x₇∧x₈∧x₉
h₂ = x₁∧x₄∧x₇ + x₂∧x₅∧x₈ + x₃∧x₆∧x₉
h₃ = x₁∧x₅∧x₉ + x₂∧x₆∧x₇ + x₃∧x₄∧x₈
h₄ = x₁∧x₆∧x₈ + x₂∧x₄∧x₉ + x₃∧x₅∧x₇
Let's look at
h₁ = x₁∧x₂∧x₃ + x₄∧x₅∧x₆ + x₇∧x₈∧x₉
The red line we saw in our last chart is one of three parallel lines, and these lines go through the points
123, 456, 789
So that's the pattern! Each of the trivectors h₁,h₂,h₃,h₄ corresponds to three parallel lines in our 3×3 grid of points... though sometimes the lines need to 'wrap around'.
Let's compare h₃.
(6/n)