Because, so far, the NASDAQ 100 ($QQQ) has declined 3.20%—and keeps falling!
But it's not a stock market drop that fascinates me because, all things considered, the NASDAQ 100 is still up 11.29% YoY.
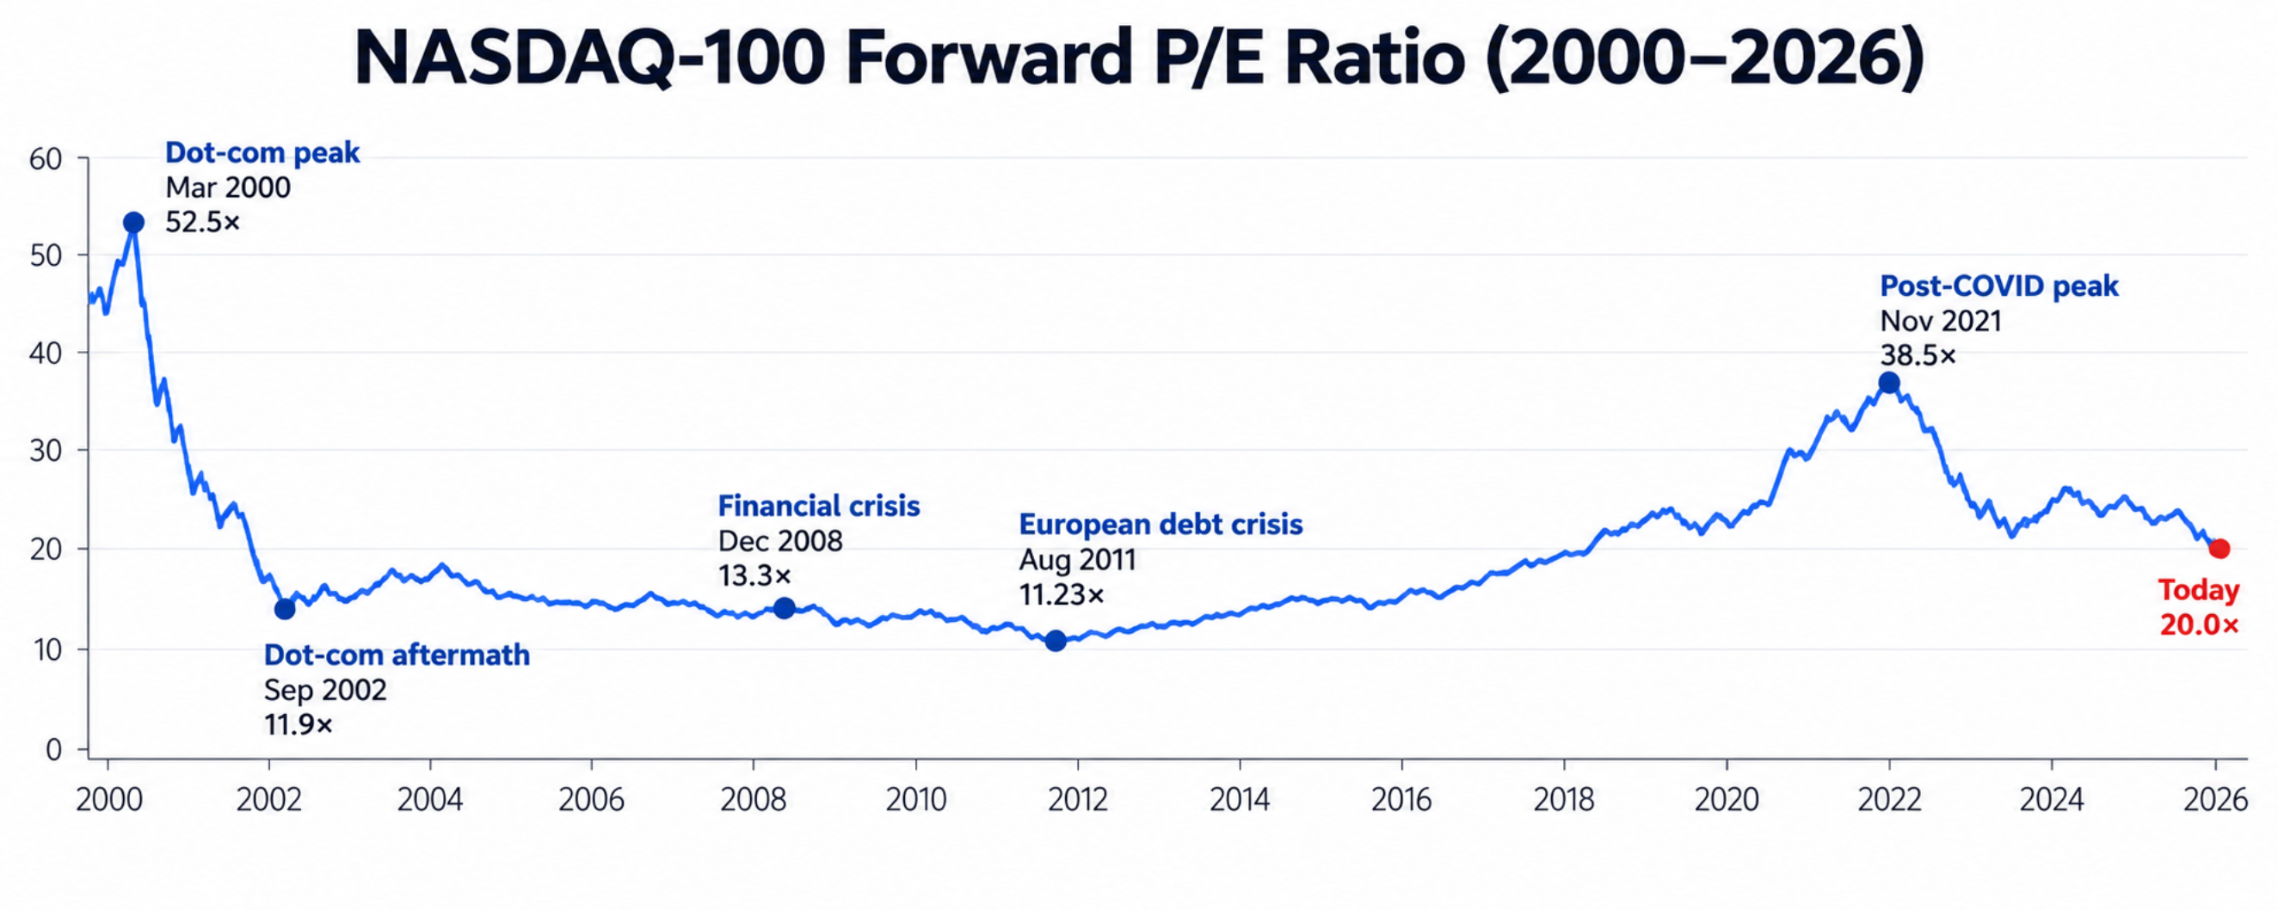
No—what interests me is that forward P/E is now **20.0×* and falling!
Translation: investors are now paying approximately $20 for every $1 of earnings companies are expected to generate over the next 12 months for the world's *largest* tech companies!
In other words, buying tech companies is getting cheaper and cheaper. Investors are paying *less* relative to the earnings growth they're *expecting*.
"But Chris, isn't that what you should expect in a speculative bubble?"
Nope! Typically in a speculative bubble, if there are earnings, the forward P/E is *much* higher—sometimes at a forward P/E of 20.0×. That is, *if* they have any earnings at all!
However, now we're in a moment where speculation is out the window. There's no debate that these tech companies can deliver earnings. The bigger question is whether capital expenditure required to support can generate sufficient profits.
And it's the word "sufficient" that's doing the heavy lifting here because "sufficient" isn't an objective measurement. It is entirely about sentiment. Because how much profit is sufficient *enough*?
What we're seeing now is that *growth* companies are now being viewed as *value* companies. Historically, investors attracted to *value* target companies with a P/E ratio of 5-20×. That's considered the sweet spot.
Which means that investors are now being offered *two* things at once: relatively inexpensive valuations associated with value stocks *as well as* substantial earnings-growth expectations associated with growth stocks.
**We can see this with today's current PEG of 0.89.**
PEG ratio compares a company's price-to-earnings multiple with its expected earnings-growth rate.
A PEG of 1.0 means the numerical P/E multiple equals the expected annual earnings-growth percentage. A PEG below 1.0 means investors are paying a comparatively low earnings multiple relative to projected growth.
For the NASDAQ-100, today's figures illustrate this:
- Trailing P/E: 26.77×
- Projected annual earnings growth: 29.98%
- PEG: 26.77 ÷ 29.98 = 0.89
This means investors are paying approximately 26.77 times current annual earnings for companies collectively expected to grow earnings at nearly 30% annually.
Put another way, a traditional value stock might trade at 10× earnings but only grow earnings by 5% annually, producing a PEG of 2.0. The NASDAQ-100, by comparison, has a PEG below 1.0 because its anticipated earnings growth is unusually high relative to its current earnings multiple.
"But how likely is expected earnings growth to be wrong?"
Well, since we're talking about *expectations*, there's no certainty. It is entirely possible to overestimate long-term earnings growth.
However, the NASDAQ-100's *recent* actual earnings performance has been exceptionally strong. In Q1 2026, NASDAQ-100 earnings per share grew 45.6% year-over-year.
And as of October 23, 2026, 95% of the 20 NASDAQ-100 companies reporting had beaten earnings expectations.
Of course, one has to take recency bias into account too.
So out of an abundance of caution, let's assume that the forward P/E ratio of the NASDAQ 100 should be 5× instead of 20×. This would be unprecedented, but let's consider it anyway.
In that scenario, the NASDAQ would lose 75% of its current valuation. That would be terrible—but not catastrophic because a fall in share price does *not* equate to a fall in earnings.
But a P/E ratio of 5× has *never* happened. Not once, even in our worst financial crises. Consider the historical record of the NASDAQ 100:
* 2002 dot-com aftermath (September) – 11.9×
* 2008 financial crisis (December) – 13.3×
* August 2011 historical low – 11.23×
Today's forward P/E is actually *lower* than the bear market of December 22, which was 20.1×.
This is why today's sell-off fascinates me. The market is behaving as though the NASDAQ-100's growth prospects are deteriorating, yet the actual earnings data tells a very different story.
Could earnings expectations prove wrong? Absolutely. Could prices fall further? Of course.
But the more the market falls without a corresponding deterioration in earnings, the stronger the investment case becomes.